

Measuring UX KPIs
1.1. Task success rate
The task success rate (TSR) measures the number of correctly executed tasks and is used very frequently. If a task has a clearly defined endpoint &– for example, filling out a form or buying a product – you can measure the TSR. However, you need to be clear about what goals you consider a success in a particular case before you start collecting data.
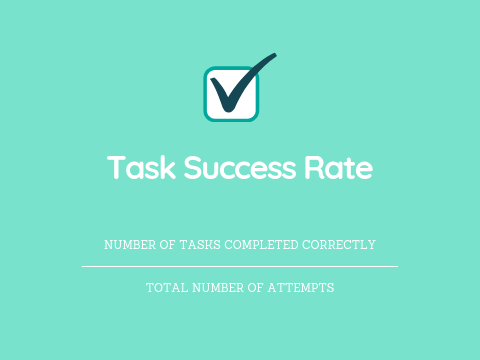
Although the TSR does not say anything about why a user is not successfully completing a task, it is an initial, very valuable indicator. Example: Ten respondents are given the task of ordering 10 red, 10 yellow and 10 white roses using express delivery and credit card payment in a flower delivery company’s online shop. Eight of the testers manage to complete the task successfully. Two testers do not succeed:
- User 1 has problems with credit card payment
- User 2 cannot locate the yellow roses on the website
In this case, the task success rate is calculated as follows: 8/10 = 0.8 x 100 = 80% Expert tip: You should also measure the TSR of users who are performing a task for the first time. This allows you to check if or how this metric changes when the user has more experience with the service or product. Basically, the higher the success rate, the better the user experience.
2. Time-on-task
This KPI describes the time (in minutes and seconds) that a user needs to complete a task successfully. The average time-on-task is usually communicated as the final UX KPI. Basically, the shorter the processing time, the better the user experience. Example: Seven respondents are given the task of locating the customer service telephone number on a website. These are the times it takes them to do this:
| User no. | 1 | 2 | 3 | 4 | 5 | 6 | 7 |
| Seconds | 22 | 15 | 60 | 24 | 18 | 31 | 17 |
In this case, the time-on-task is calculated as follows: (22+15+60+24+18+31+17)/7= 26.71 seconds
3. Search vs navigation
Navigation bars represent an important instrument within the website’s ‘orchestra’: if a user does not manage to reach their destination via the navigation, then the search function is usually the next logical step. In many cases, the less the search function is used, the better the customer experience. It is always advisable, however, to decide on a case-by-case basis which of the two metrics is more desirable. Let’s take the example of a website with only 10 subpages, which typically would have no search function and does not need one due to its clarity.
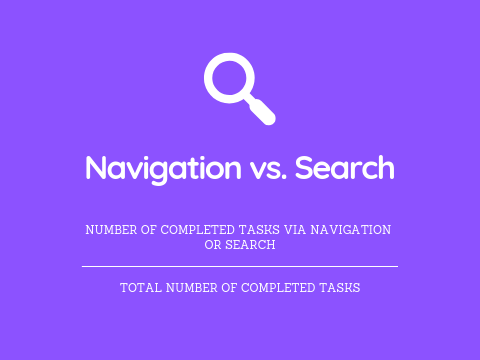
Example: You give nine testers the task of ordering three sunflowers in a florist’s online shop. Then you analyse how many users use the navigation and search fields.
123456789#%
| User no. | |||||||||||
| Search | X | X | X | 3 | 33 | ||||||
| Navigation | X | X | X | X | X | X | 6 | 66 |
Calculation of the search/navigation ratio: Search 3/9 = 0.33 x 100 = 33% Navigation 6/9 = 0.66 x 100 = 66%
4. User error rate
The user error rate (UER) is the number of times a user makes a wrong entry. Let’s take the example of the usually unsuccessful attempt to enter the user’s date of birth in the address field. The UER gives you an idea of how clear and user-friendly your website is. The higher the UER score, the higher the number of usability problems. Again, it is important to define in advance which actions represent an error. The user error rate can be calculated in different ways. Here are the two most common types of measurement: Error occurrence rate: If a task only allows one potential error (or there are several and you only want to measure one of them), this is the metric to use.
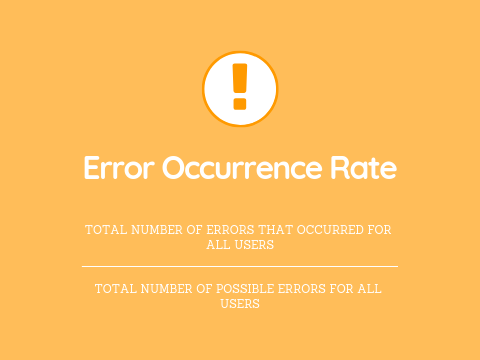
Example: Five out of 100 users enter their e-mail address incorrectly in the ‘Repeat e-mail address’ field. The error occurrence rate is calculated like this: 5/100 = 0.05 x 100 = 5% Error rate: If multiple errors are possible per task (or you want to measure multiple errors), you can do this using the error rate.
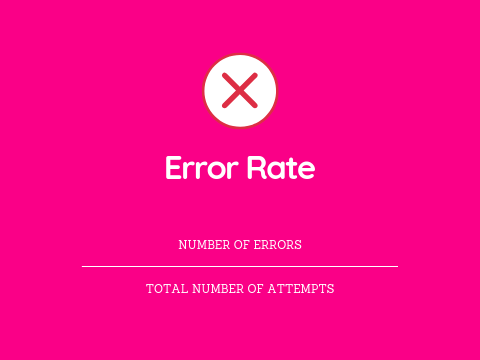
Example: Six testers have the task of making an international bank transfer in a bank’s online portal. The task entails five possible errors and the user error rate is distributed as follows:
| User no. | 1 | 2 | 3 | 4 | 5 | 6 |
| Number of errors | 3 | 1 | 2 | 3 | 2 | 1 |
The error rate is calculated as follows: (3+1+2+3+2+1)/6×5= 0.4 x 100 = 40%
Attitudinal UX KPIs (what they say)
This type of UX KPI measures how users feel or what they say before, during or after purchasing a product. In this section, I will introduce three prominent examples of this type:
5. System Usability Scale (SUS)
According to its inventor John Brooke, the System Usability Scale (SUS) is a ‘quick and dirty’ tool with which you can test the usability of a product. The scale consists of a 10-point questionnaire with five possible answers each, ranging from strongly agree to strongly disagree.
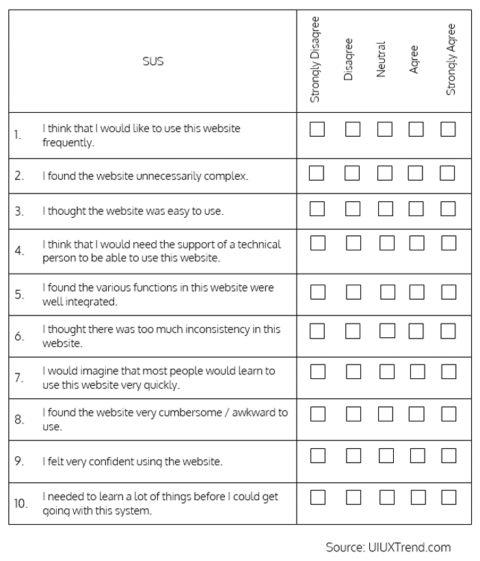
Example: You want to measure the usability values of your website. Using the questionnaire results, you can calculate the ‘SUS’ score (0 to 100), which averages 68. Therefore, if your website scores below 68, it will typically have serious flaws and will need to be optimised.
6. Net Promoter Score (NPS)
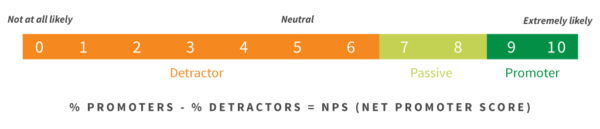
The Net Promoter Score illustrates customer satisfaction – and loyalty – in one simple metric. Several studies have also confirmed that the NPS is statistically relevant and correlates with a company’s growth. The user is asked only one central question to determine the NPS: How likely is it that you will recommend (brand, website, service, etc.) to a friend or colleague? The user answers this question on a scale of one (very unlikely) to 10 (very likely).The answers are then grouped into three categories, with the ‘passives’ not taken into account in the calculation:
- Detractors: 0 to 6
- Passives: 7 to 8
- Promoters: 9 to 10
Net Promoter Score: (Number of promoters – number of detractors) ÷ (number of respondents) x 100 Example: A survey with 50 participants returns the following results:
| Category | Number |
| Detractors (0-6) | 10 |
| Passives (7-8) | 10 |
| Promoters (8-10) | 30 |

This is how the Net Promoter Score is calculated: (30 – 10) ÷ 50 = 0.4 x 100 = 40% Further information about NPS and its calculation can be found here.
7. Customer satisfaction (CSAT)
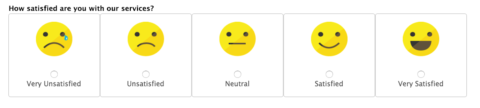
The CSAT is another attitudinal UX KPI that expresses customer satisfaction in a convenient metric. Users/testers are asked: How satisfied are you with (website, product, service, etc.)? The result is a percentage from 0 to 100, where 100 stands for maximum customer satisfaction. The scale usually includes five rating options, ranging from very dissatisfied to very satisfied.Since the CSAT score can be determined quickly and easily, it is also possible to measure it at several points of interaction with a customer (such as in the TOFU, MOFU and BOFU phases). With this method, it is possible to determine at which point in the funnel the customer might still be stuck. Customer satisfaction: (Number of satisfied customers) / Number of respondents x 100 = % of satisfied customers The survey results are then classified and evaluated as follows:
- Very dissatisfied
- Dissatisfied
- Neutral
- Satisfied
- Very satisfied
To calculate the CSAT score, only the answers of the satisfied users are counted, i.e. the users who gave ‘satisfied’ or ‘very satisfied’ as an answer. Example: After a successful purchase, ten customers are asked how satisfied they are with the usability of your website and give the following answers:
12345678910
| User no. | ||||||||||
| Answer | 2 | 4 | 5 | 3 | 5 | 1 | 4 | 2 | 1 | 5 |
| Satisfied customers | X | X | X | X | X |
The CSAT score is calculated as follows: (5 / 10) = 0.5 x 100 = 50% Further information on the customer satisfaction score can be found here.