
UX process into agile
Lean helps you build the right thing. Agile helps you build the thing right.
My Role: Senior UX/UI Designer & Researcher.
Tools: Sketch, Invision, Hotjar, Abstract, Git, Visual Studio Code
From discovery phase to MVP
In October 2019, I took up a project to meet UX needs of our client, AXA partners, Barcelone. I began to collaborate closely with LAB team, and the Daimler project came to us.
As a UX Designer and researcher, my role included several tasks as shown in the image below. Even if was not involved in the proper dev side, I was in a continue iteration with Dev team.
The power of a Design Sprint lays on getting as much insights as possible in a very hard two days workshop, creating massive solutions with experts, and voting on them and relying on a consensual bet to create a prototype on the 3rd day, which one will be tested with real users on the day 4th, and finally get a report of insights, assumptions, and establishing agreements with stakeholders on what we want to build.
Phase 2
Delivering a HI FI prototype
Once we've been testing our first prototype during the Design Sprint, we were ready to continue on the creation on the next screens, delivering the proper HI FI prototype to the development team, using Sketch in the design stage and Invision for the proper deliveries.
Phase 3
Building the web app
From November 2019 to February 2020 we were in a constant iteration among different actors such as Project Manager, Product Owner, Backend and Front End, and Business Analyst. Discussing about the new features and how to achieve our main goal: the April 1st Go Live.
It was a very hard tight time, with a strong commitment. Always in agile mode with 2 weeks sprints, gathering feedback from stakeholders. Having a fluent conversation with operations and business side to be aligned with the common goals.
Phase 4
Testing, data collection and getting insights
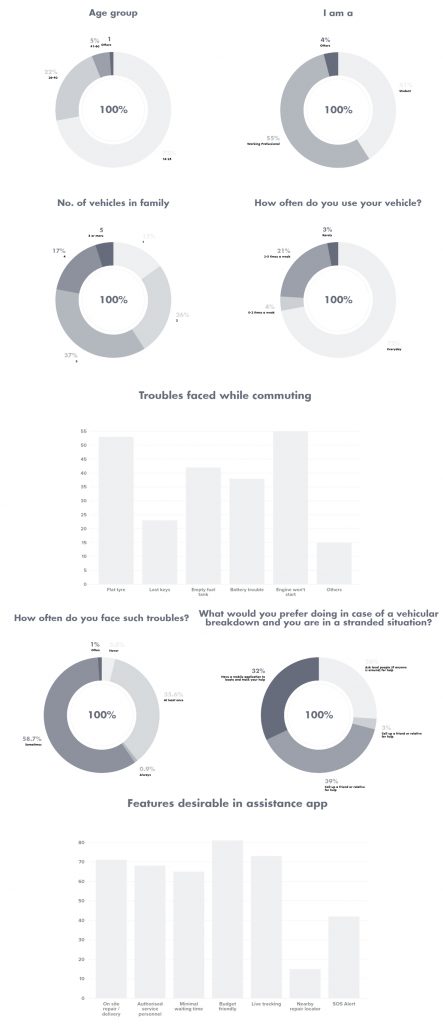
During February 2020, when we had a stable version for the main screens and features, we created and conducted a Test plan with 9 real users from 6 different countries in our headquarters in Paris to detect paint points.
In addition, we wanted to obtain quick and easy data about the usability of the tool through SUS (System Usability Scale). The results were obvious.
Benefits of using a SUS
SUS is a quick way to measure the usability by asking to the users about scoring 10 questions . The noted benefits of using SUS include that it:
- Is a very easy scale to administer to participants
- Can be used on small sample sizes with reliable results
- Is valid – it can effectively differentiate between usable and unusable systems
With usability testing and SUS results we were able to analyse combining them, and delivering a few recommendations mainly for business and development side to improve the tool by doing some tweaks and helping to decrease user frustration. We also got a detailed list of features that users expected to have in the application.
Once the tool went on live, we began to collect data with Hotjar. This data comes as polls, visitor recordings and heatmaps.
We wanted to focus on the frustration of the users, therefore we decided to make a funnel with the almost 1000 responses, boiling down to 10 recordings based on the worst experiences and trying to understand why there were such high levels of frustration.
We were interested to know if the users were able to recognize the switch on the right side to start working on the cases. Also this heat map, together with the observation of their behavior, gave us clues about what users did when they got stuck in the process.
Through the sessions recordings, we were able to observe erratic behavior. In addition, these recordings helped us to account for moments in which the system did not work well. Something unexpected and quite useful to contrast with the incidents that came to operations.
Feedback data: Polls
We asked to agents and supervisors two simple questions:
Can you describe your experience using the HUB?
How we can improve the HUB to make it easier to use?


Description
Daimler
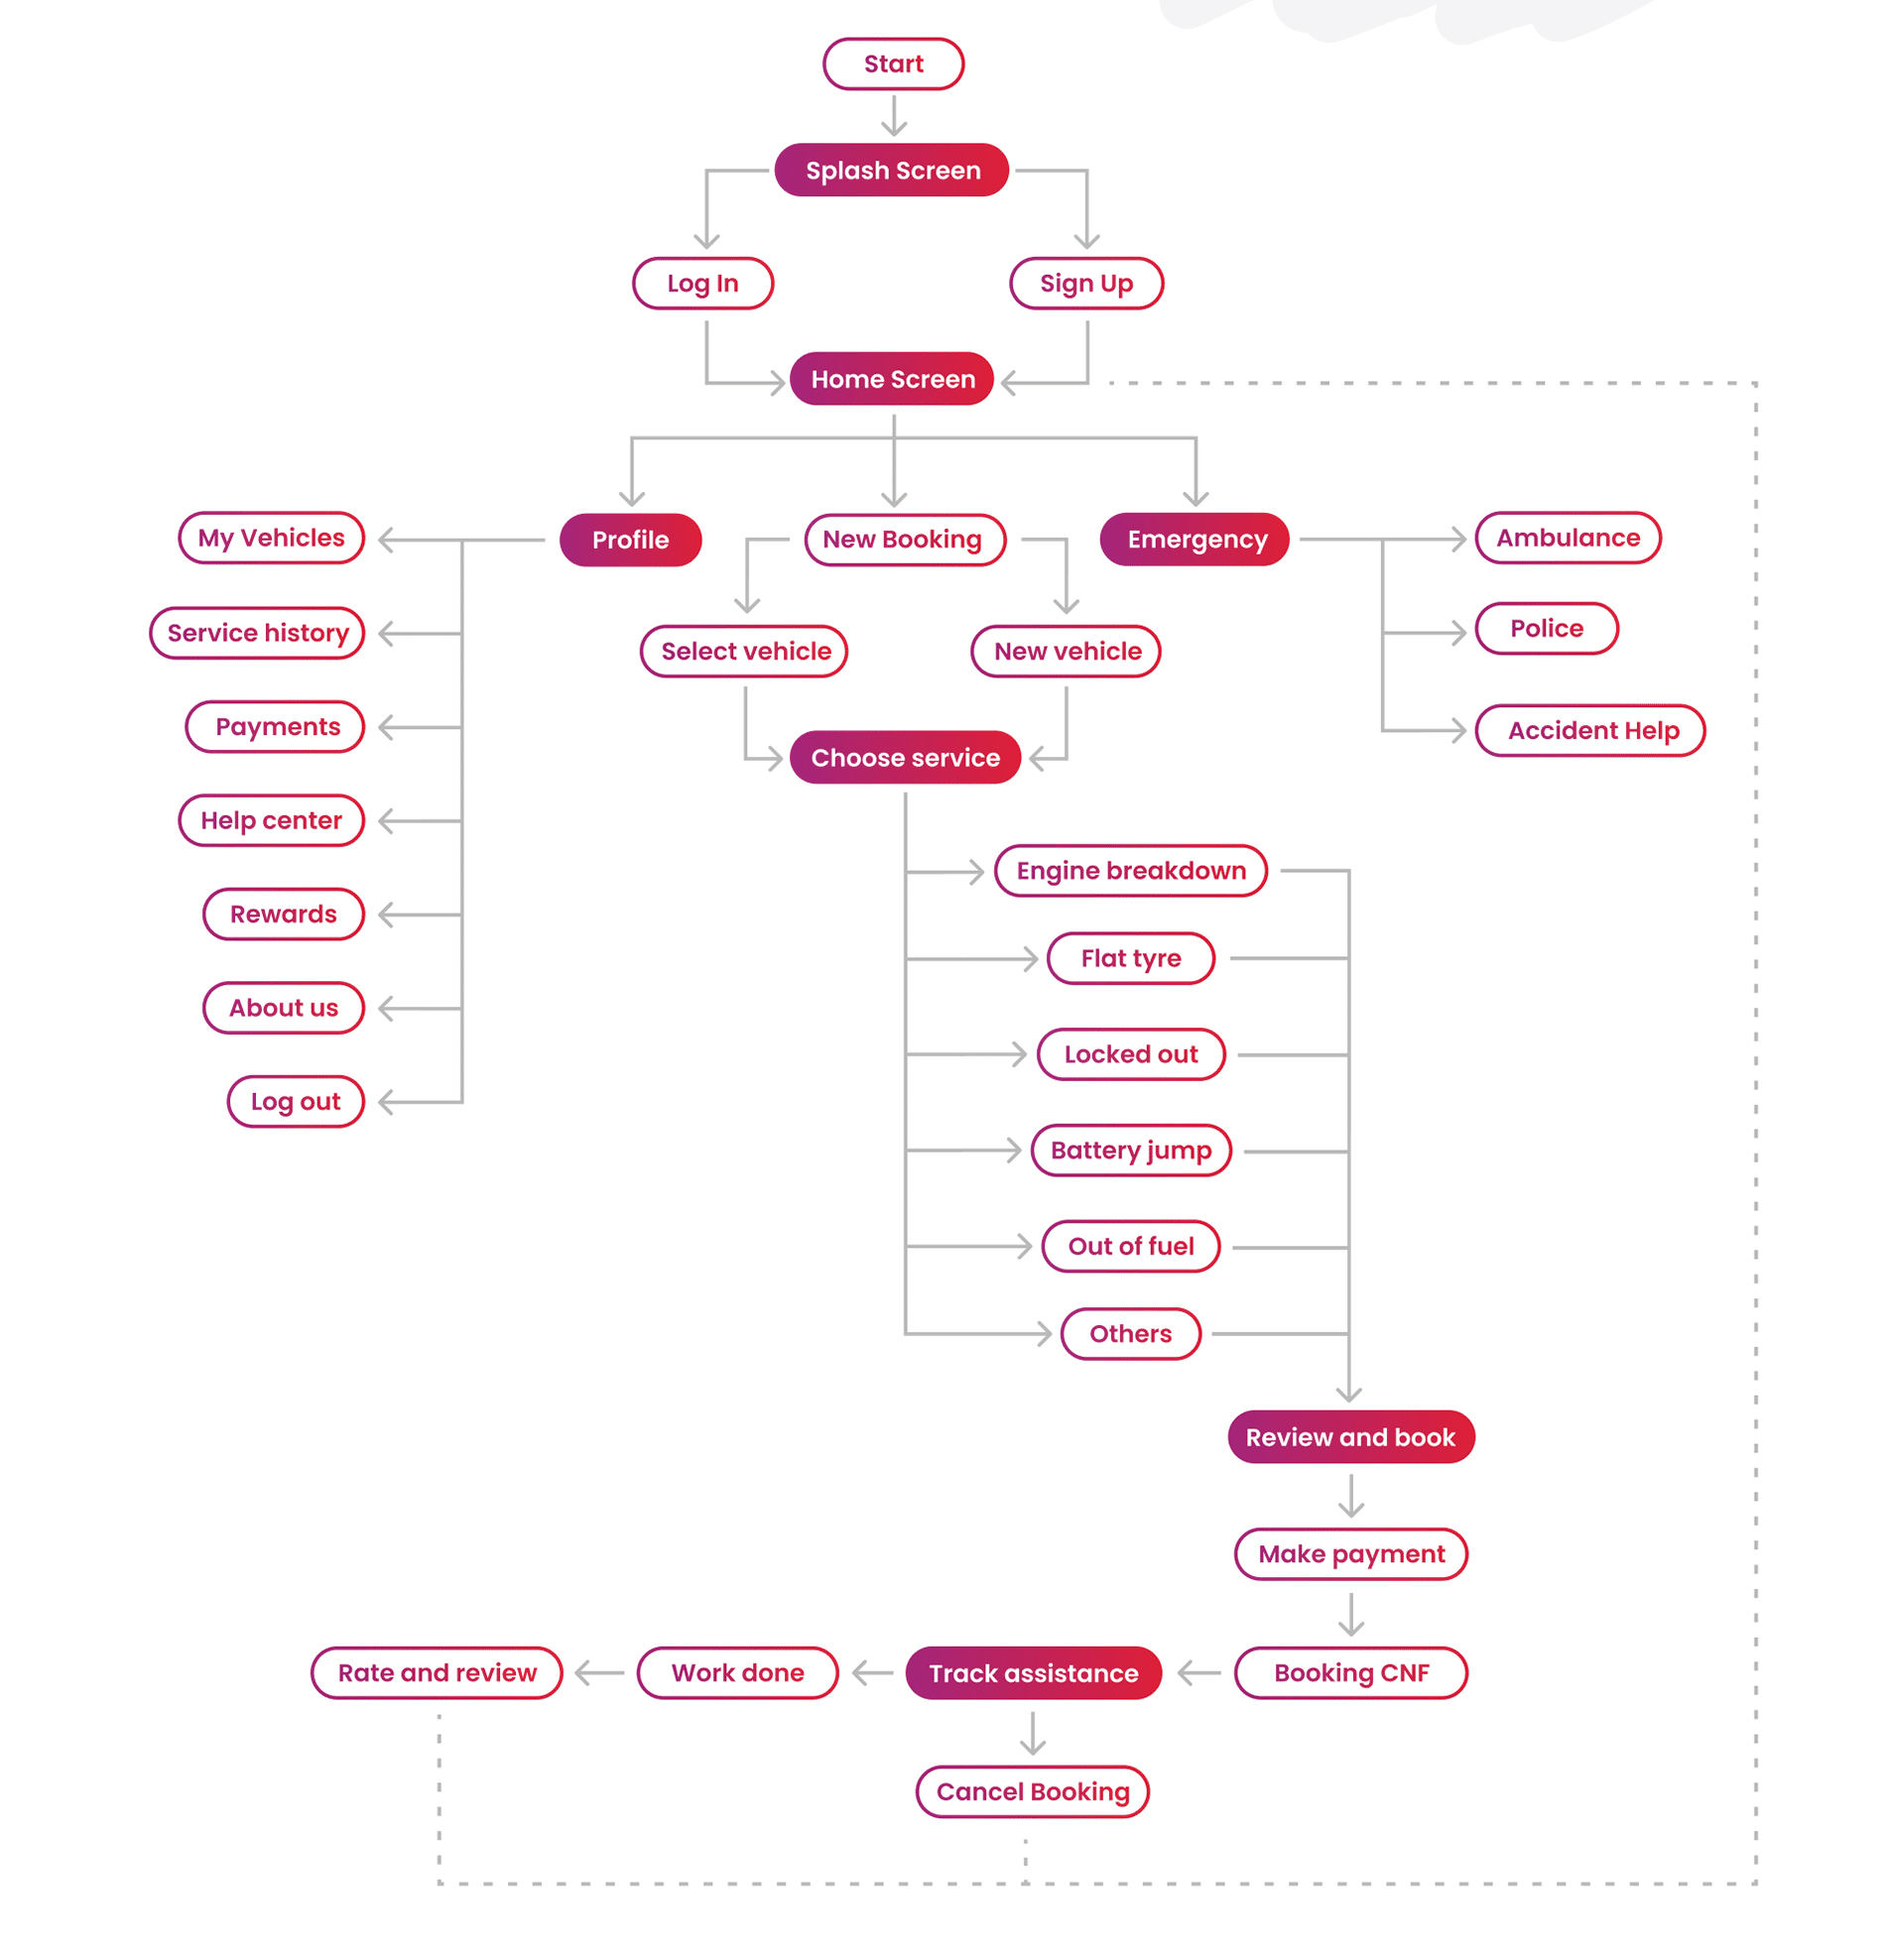
Daimler HUB is a web application based on React to manage Road Side Assistant incidents in 44 countries.