
Redesigning Optimetrix for Reseller success
Designing for complexity demands a seamless balance between functionality and intuition.

Overview
The Optus's network is utilized by various resellers, including Amaysim, Virgin Mobile, and TPG, who rely on Optus’s Optimetrix platform to monitor and manage their customer interactions and network performance. However, Optimetrix has become outdated.
I was tasked with redesign Optus's Optimetrix to be a cohesive, user-centered, and data-driven experience that met the nuanced needs of various user groups. Optimetrix provides three primary dashboards:
- Service Management,
- Customer Satisfaction, and
- Network Performance Monitoring.
Project Goals
To redesign Optimetrix as a responsive, scalable platform capable of meeting current and future reseller needs, my objectives were:
- Improve User Engagement
- Optimize KPI Visibility and Insights
- Support Business Outcomes
- Streamline Processes and Improve Efficiency
Design Process and Methodology
1. Research and Discovery
User and Stakeholder Interviews: Understanding the different user groups and their priorities was paramount. I conducted extensive interviews with key stakeholders, including resellers and internal teams responsible for maintaining network operations and customer satisfaction. The aim was to identify pain points, preferences, and critical KPIs that would inform dashboard configurations.
View high-res original image
- Key Findings: Resellers emphasized the importance of readily available, digestible data that allows for both daily checks and long-term trend analysis. The need for real-time metrics such as customer churn rate, network usage, and customer support tickets were critical for proactive business decision-making.
- Stakeholder Alignment: Through workshops, I facilitated discussions on key insights and prioritized features based on business and user value.
Competitor Analysis: I examined existing telecom platforms to identify features that resonated with users and areas where they fell short, such as limited drill-down functionalities or clunky navigation. Insights from this analysis helped set benchmarks and differentiate Optimetrix with a user-centric approach.
Data Analytics: Reviewing existing user data helped identify where previous designs had shortcomings, such as underutilized widgets and high exit rates from certain dashboard views. These analytics drove initial hypotheses on layout restructuring and feature prioritization.
2. Defining Information Architecture and Workflow
Dashboard Hierarchy Development: Organizing the dashboards into three core categories—Service Management, Customer Satisfaction, and Network Performance Monitoring—allowed for a streamlined hierarchy that catered to distinct user goals without overwhelming them with irrelevant data.
Login Screen:
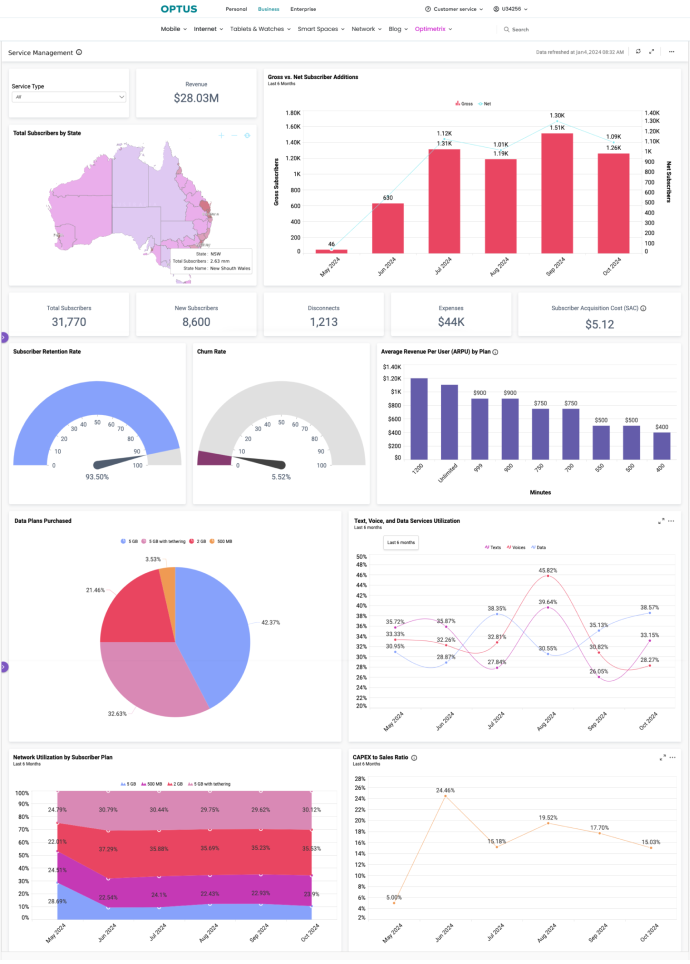
Service Dashboard:
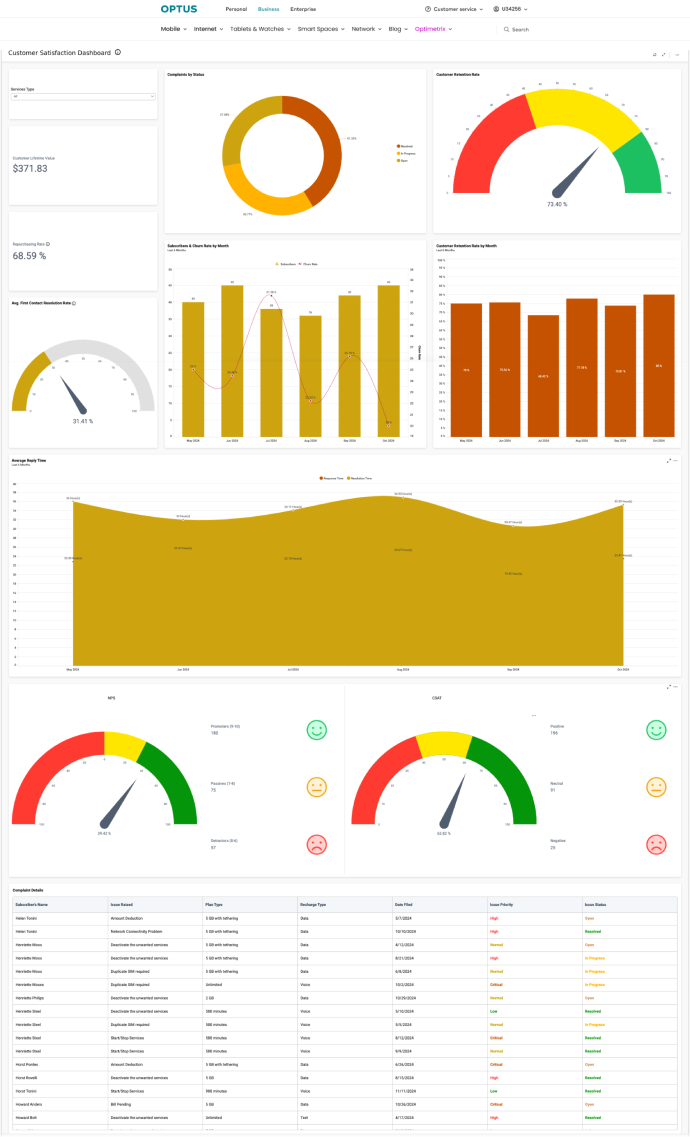
Customer Dashboard:
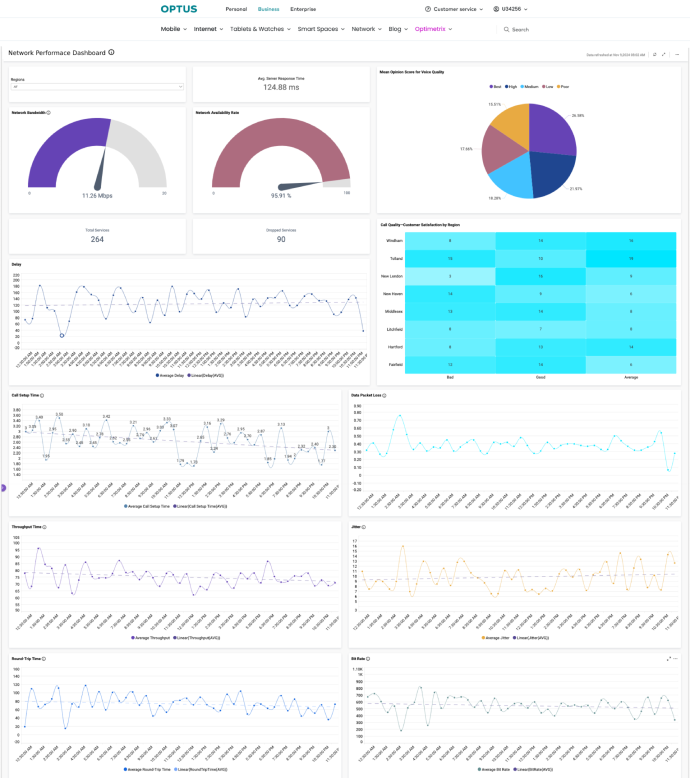
Network Dashboard: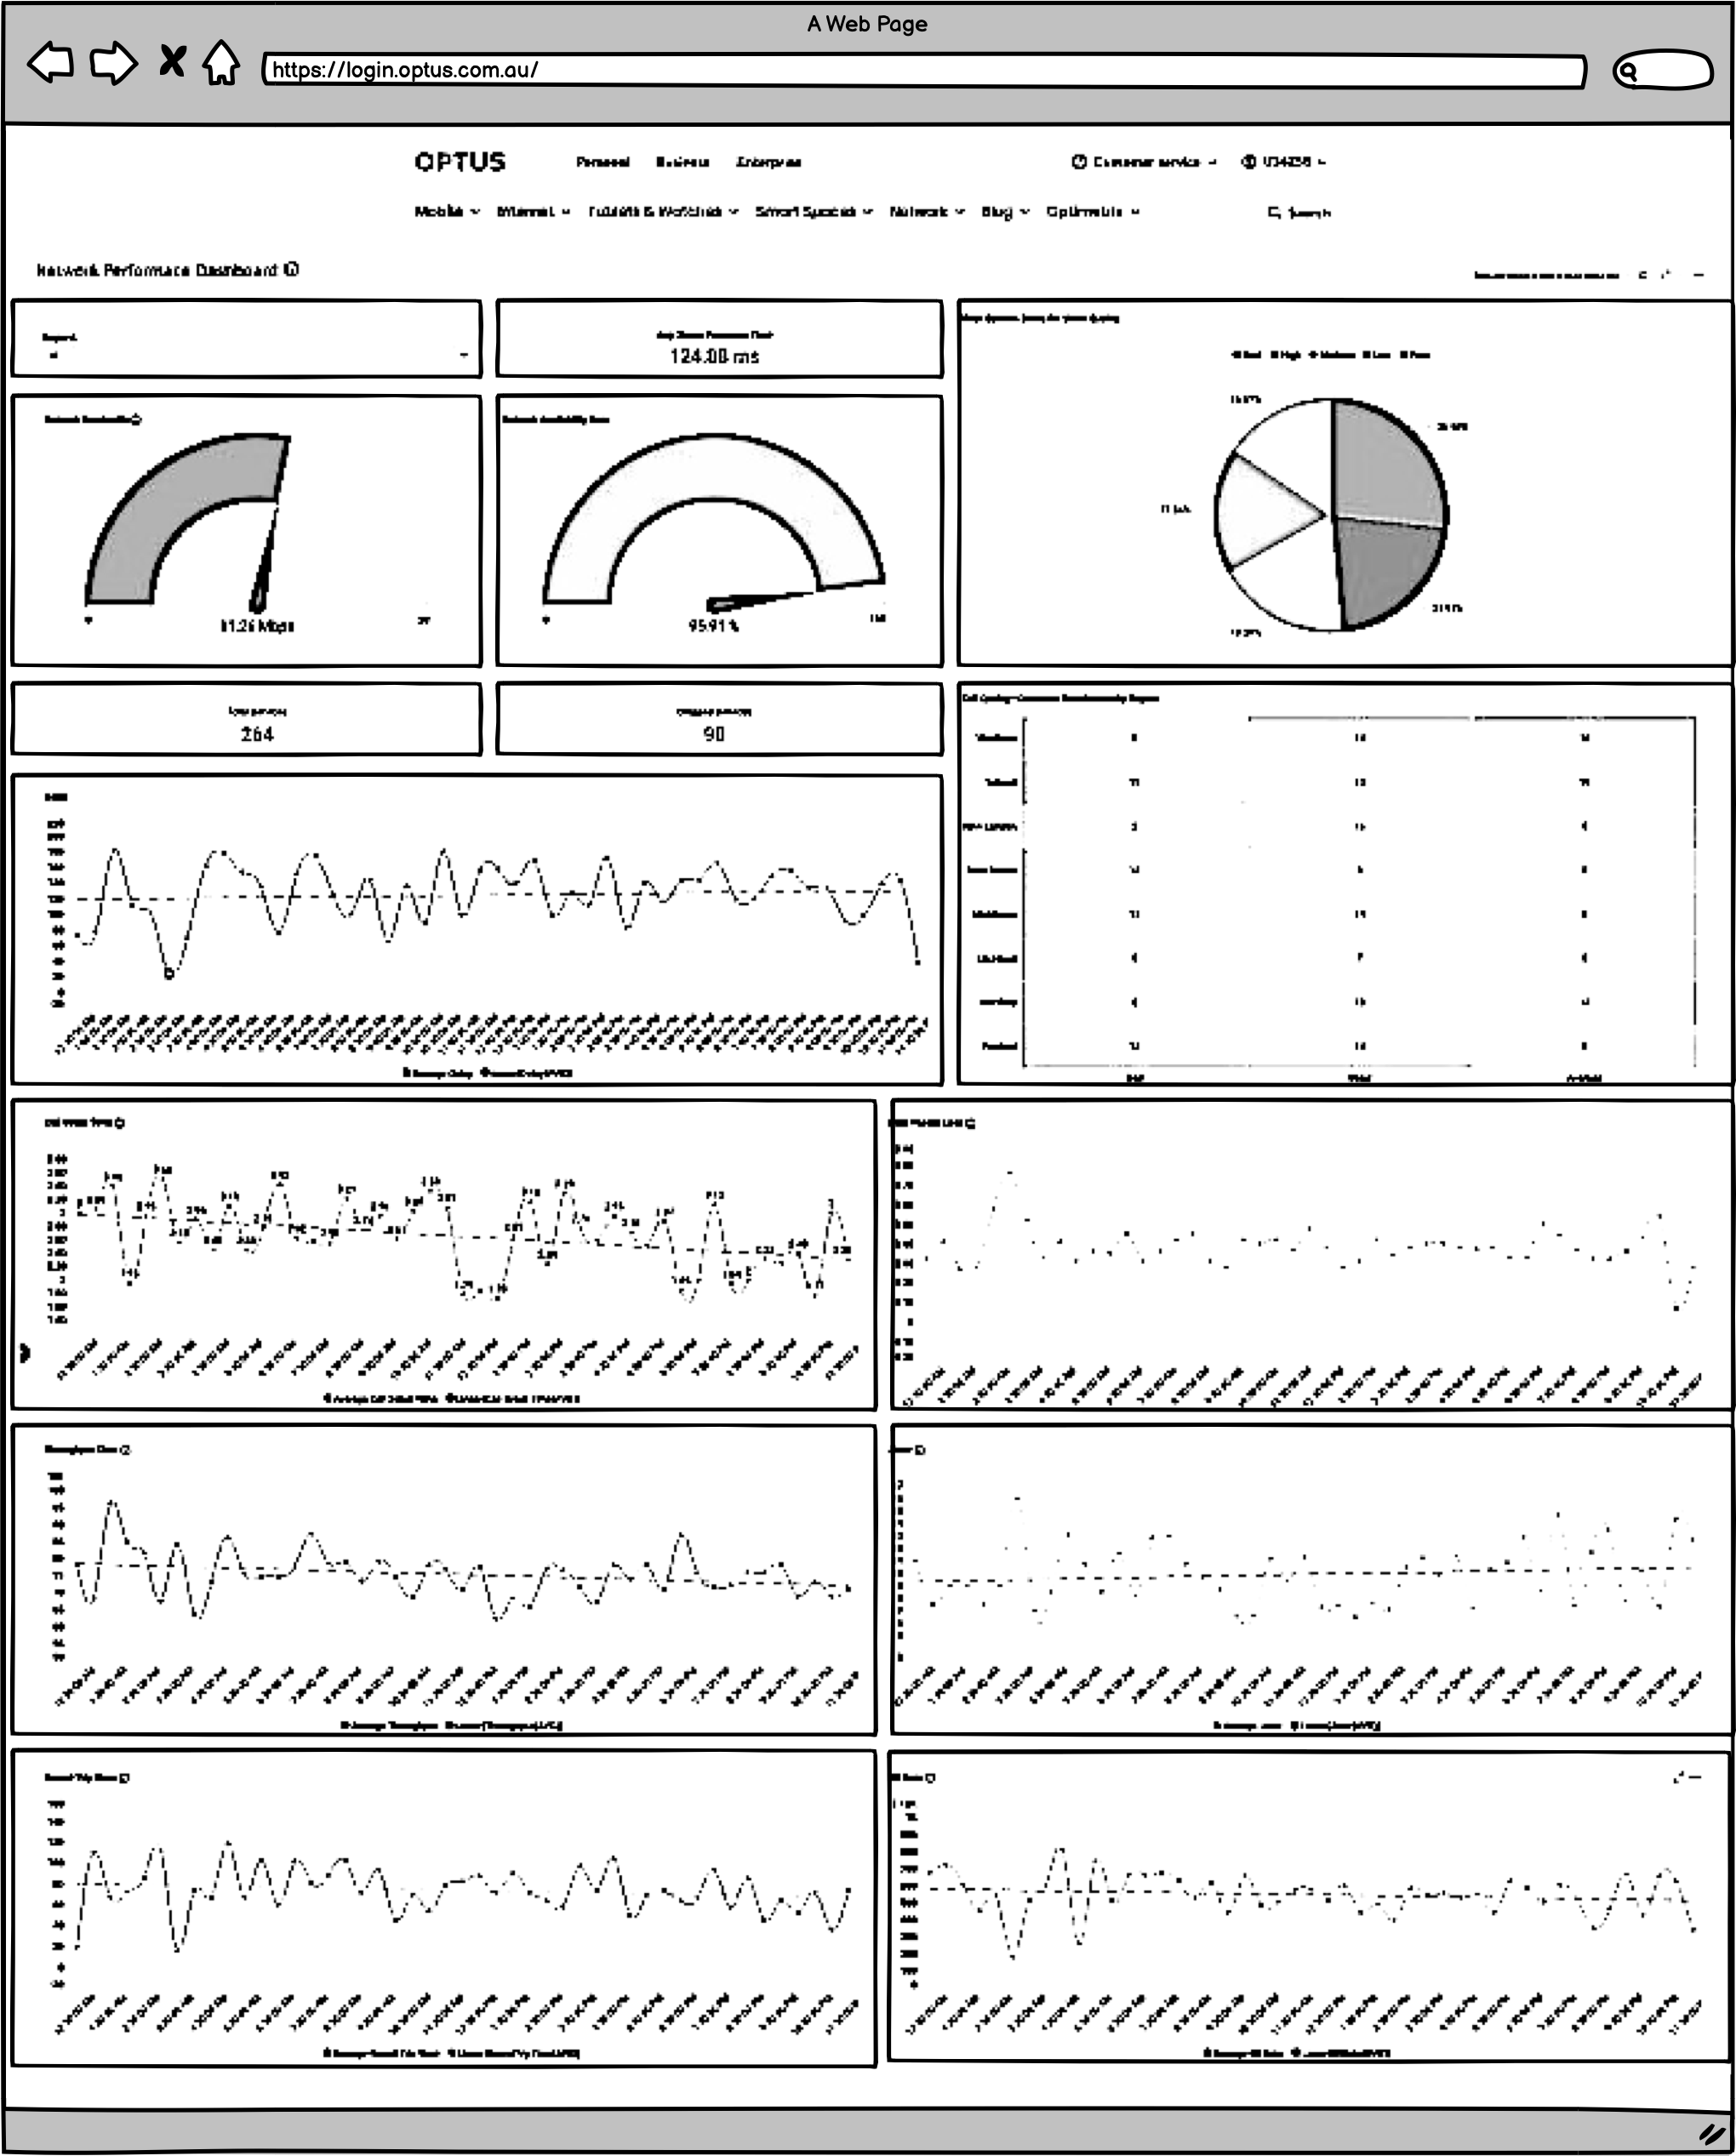
Mapping User Journeys and Decision Trees: I created user journey maps and task flows to understand user interactions across various scenarios, such as investigating a sudden drop in network performance or analyzing subscriber churn. These decision trees informed how to structure each dashboard’s layout and prioritize widgets for user workflows.
Wireframing and Prototyping: I developed low-fidelity wireframes to validate layout ideas and widget placements with users. As insights were gathered, I refined these into high-fidelity interactive prototypes, ensuring each dashboard provided a coherent and intuitive experience.
- Service Management Dashboard: This dashboard tracks financial health, customer churn, and subscriber usage. The design includes drill-down widgets for detailed insights, allowing users to review revenue versus expenses, subscriber counts, and usage trends across service types.
- Customer Satisfaction Dashboard: Designed to monitor support ticket resolution and customer spending habits, this dashboard includes segmented views and filters for individualized customer insights.
- Network Performance Dashboard: To aid technical and non-technical users alike, this dashboard provides visualizations of call drop rates, call setup times, and regional performance. The inclusion of a region filter allows granular analysis.
3. Interaction Design and Visual Language
Design System Creation: I established a consistent visual language across the platform, utilizing the Optus brand color palette for a unified experience. I leveraged an iconography set and standard typography from Optus Design system (BEAM), which made navigation intuitive and ensured accessibility compliance. Each element was crafted with AA/AAA WCAG standards in mind to enhance usability for all users.
Widget Interaction: Given the extensive data available, widgets required careful design for easy drill-downs and real-time updates. For example, I implemented expandable revenue and network utilization graphs, enabling users to view monthly or quarterly breakdowns without losing the context of overall trends.
4. Testing and Iteration
User Testing (Qualitative and Quantitative): I conducted several rounds of usability testing to validate user flows and test widget functionality. Sessions were recorded and analyzed for user feedback on widget utility, data readability, and navigation ease.
- Quantitative Data Analysis: Using Google Analytics and Tableau, I measured engagement rates, click-through rates on widgets, and session durations to validate our hypotheses and assess whether users engaged more with the redesigned features.
- Qualitative Feedback: Direct user feedback from resellers highlighted areas for improvement, such as filter placement and widget resizing options. Adjustments were made to increase flexibility, such as adding a toggle to view customer satisfaction ratings as a breakdown by service type or by specific support issues.
Iterative Refinements: Based on test results, several adjustments were made, including reducing visual clutter on the dashboards and refining filter functionalities. For instance, the “Region” filter on the Network Performance dashboard was redesigned to be more prominent, allowing users to easily analyze regional performance without disrupting the data’s overall flow.
5. Launch and Post-Launch Analysis
After the platform went live, I continued to track user engagement through data analytics, focusing on KPIs such as churn rate, network usage metrics, and support ticket resolution rates. We also tracked user retention on the dashboards, which allowed us to measure the platform's impact on resellers’ business outcomes.
Key Results:
- Enhanced User Engagement: Engagement on the platform increased by 30%, with high engagement rates on the Service Management dashboard’s revenue tracking widgets.
- Reduced Churn Rate: By leveraging customer satisfaction insights and support ticket data, resellers could proactively address customer concerns, resulting in a 15% decrease in customer churn among early adopters of the platform.
- Increased Efficiency: Resellers reported a 40% reduction in the time required to access key metrics, thanks to optimized workflows and an intuitive layout.
Reflections and Key Takeaways
The Optimetrix redesign underscored the importance of balancing complexity and usability. Designing a robust, data-heavy platform requires an intuitive layout and user-centric functionality to ensure that complex data translates into actionable insights. This project reinforced my commitment to cohesive UX strategy, stakeholder collaboration, and data-driven decision-making. Each design decision was backed by user feedback and rigorous testing.
Description
Optus
Optus is one of Australia’s leading telecommunications providers, offering a wide range of services including mobile, broadband, and entertainment. Committed to delivering innovative solutions and exceptional customer experiences, Optus connects millions of Australians to the people, information, and entertainment that matter most. With a strong focus on technology and customer satisfaction, Optus continues to shape the future of digital communication in Australia.